Direct or specific property management:
Companies that focus primarily on direct property management (Representing 43% of companies)


The growth in investments, to a remarkable $20.41 billion invested in PropTech during the 2021-2022 fiscal year was in part thanks to the simple growth in the raw numbers of investors in the industry. While there were around three thousand total investors between 2000 and 2019 when we composed the 2020 Barometer, the number of investors remained remarkably high when we narrowed the focus to a single year for the 2021 Barometer. Indeed, there were some one thousand eight hundred investors from 2020 through 2021, who raised $12.05 billion.
The current trend is: while total investments have nearly doubled, the number of investors in PropTech has more than doubled, reaching a record high of 4,693 investors in a single fiscal year. Thus, this year we will be telling the story of remarkable growth of investments, while also considering how the field of the marketplace has shifted. Does the remarkable increase in the raw number of investors represent a leveling of the playing field? Or, does it represent an awakening of major players to the realization that they, too, should be involved in PropTech?
While it is true that the PropTech industry did expand to three new countries over the course of the past few fiscal years (from 64 countries in 2020, to 66 in 2021, to 67 in 2022), the growth of PropTech across borders alone does not explain the growth in investments. Furthermore, with the advances in technologies and the ever-changing nature of the global economy, the PropTech industry has experienced some restructuring in terms of mergers and acquisitions.
Figure 1 shows the amount of new investment in PropTech firms from fiscal year (FY) 2011-12 to FY 2021-22. New investment in PropTech firms has been increasing every year and FY 2021-22 saw a record amount of investment totaling $20.41 billion which is a 17% increase year over year (YOY). Notice the interesting and sizable jump in investment levels in FY 2016-17 in which the investment amount doubled from previous year and then kept climbing up with a slight decline in FY 2019-20, which was clearly due to the uncertainty about economic activity due to Covid-19 pandemic.
Figure 2 shows the top investors in the PropTech industry in the past one year. Like in the previous year Softbank leads the list having invested more than $1.8 billion, followed closely by Capital One with $1.4 billion. Fascinatingly, Capital One, Fifth Wall, Ribbit Capital, Saluda Grade, The Gores Group, Silver Lake, UK Export Finance, Founders Fund, and Brookfield Asset Management are all newcomers to this top investors list. This highlights the new and increased interest in companies operating in the PropTech industry

Figure 3 identifies the top performing PropTech companies in terms of attracting investments. Here again we have a bunch of newcomers to this list compared to last year including top-performing companies. These newcomers include Yanolja, EquipmentShare, AvantStay, Entrata, Bechtel Corporation, ICON, Sonder, and Doma. Yanolja, a South Korean company founded in 2005, topped the list by attracting $1.7 billion. EquipmentShare, a company founded in 2014 in Missouri, United States, came in second place with $1.4 billion in funding.
Figure 4 shows the top countries by investment destination. As expected, the United States, host to the largest number of PropTech companies, attracted significantly more investment than any other country with over $14 billion in investment which is close to 70% of the total investment made in FY 2021-22. However, South Korea, which is second on this list with $1.78 billion, was not even in this list last year. Another newcomer to this list is Colombia which attracted $260 Million of investment.

With the record number of Mergers and Acquisitions in the past year (73) and the strong trend toward the acceleration of market consolidation over time, we might wonder why the dip appears in 2019, as there were just 37 Mergers and Acquisitions. We explain this dip through the nature of the fiscal year. We suspect that there was a standard increase in Mergers and Acquisitions during the last two quarters of 2019 and the first quarter of 2020. However, since the COVID 19 pandemic hit at its most severe point during the second quarter of 2020, with all business screeching to a halt as the world went into lockdown, we have calculated that there were virtually no mergers and acquisitions during that quarter.
As businesses began to reopen and receive more investment during the course of the 2020-2021 fiscal year, we begin to see more mergers and acquisitions again. However, the major market disruption of the pandemic did not significantly shape up the top companies that were leading acquisitions. CoStar, Zillow, AirBnB, Trimble, AutoDesk, and ANGI Homeservices have all remained top acquiring companies. That these massive companies would remain at the top of the list is not particularly surprising. However, what is surprising is that there are three new companies that have shot onto the top acquiring list.

As Figure 8 shows, Blackstone Group, Jones Lang LaSalle, and Fortive are all newcomers to the top-acquisitions list within the past year. Blackstone is a firm that focuses on mergers and acquisitions, founded in 1985 by two former Lehman Brothers employees. However, their previous emphasis has been on private equity and alternative investments. Then, they entered into the market purchasing singlefamily homes to rent between 2007 and 2010.

The overall trend with the top acquiring companies is that a few large entities (CoStar, Zillow, Blackstone, RealPage), which we would assume have significant interest in acquiring vast numbers of startups, are also acquiring major firms that are decades old, allowing them to diversify their portfolios. Furthermore, some of these massive corporations, like Zillow and AirBnb, are in fact PropTech startups themselves. Thus, in those cases, if they were to acquire too many similar firms, they would adversely affect competition.
A Special Purpose Acquisition Company (SPAC) is sometimes known as a “blank check” company. These companies are a tool that investors use in acquisitions. For one of our case studies, our team examined elements of SPACs and how SPACs help companies through the Mergers & Acquisitions process. Very importantly: a SPAC can be listed on the public stock exchange without going through the typical public offering process. Thus, they are a tool to allow investors to pool funds and finance a merger or acquisition within a given time frame. Stock exchanges such as the NASDAQ or NYSE often see SPACs in their listing. An example of a well-known PropTech company that went public via SPAC is OpenDoor, in December 2020. However, SPACs have also appeared in recent years on the Euronext Amsterdam, Singapore Exchange, and the Hong Kong Stock Exchange. In addition to the above data, SPACs continued to increase in 2019 and 2020, as there were 59 SPAC transactions in 2019 and 248 in 2020, with over 300 in 2021.

In 2007, the Pan-European Hotel Acquisition Company N.V. became one of the first, if not the first SPAC listed on a European stock exchange. Since 2007, signatures of SPACs have proven to be relatively efficient and inexpensive, compared to other means of raising capital and the process of IPOs. SPACs often provide higher valuation, less dilution, increased certainty, increased transparency, less regulation, and fewer fees than IPOs. Nevertheless, as figure 8c shows, we are seeing that SPAC IPOs were quite high up until 2008. Also, around 2006, SPACs proved to be a valuable means of acquisitions.
With the increasing trends of acquisitions in coming years, we would expect to see increasing numbers of SPACs as well. Perhaps most famously, WeWork announced it would go public via SPAC in March of 2020. However, other famous companies, such as OpenDoor, Offerpad, and Matterport also announced or completed SPAC mergers in 2020. SPACs in PropTech are attractive because the capital needs in PropTech companies tend to be higher than other industries, such as software.
SPACs managers are also attractive because they can spend a significant amount of time with PropTech practitioners and company leadership, learning deeply about the business models, and therefore educating the broader market more easily than other means of attracting investors. The robust environment of Mergers and Acquisitions (M&A) in PropTech also makes this particular sector attractive for SPAC players. Finally, there have been some changes in the PropTech market recently that have coincided with the SPAC boom. In short, the pandemic forced innovation, while SPACs were out searching for fast-growing companies, and PropTech businesses were growing at unforseen rates, creating a need to access new capital more quickly than before in order to continue to scale. These factors have grown to stimulate SPACs as a feature of the PropTech world.
Companies that focus primarily on direct property management (Representing 43% of companies)

Companies that manage payment between tenants, landlords, financial services or asset managers (Representing 30% of companies)

Companies that facilitate communication between tenants, owners, managers, occupants, neighbors and service providers (Representing 16% of companies)

Companies with a specific focus on delivering a technological product (Representing 11% of companies).
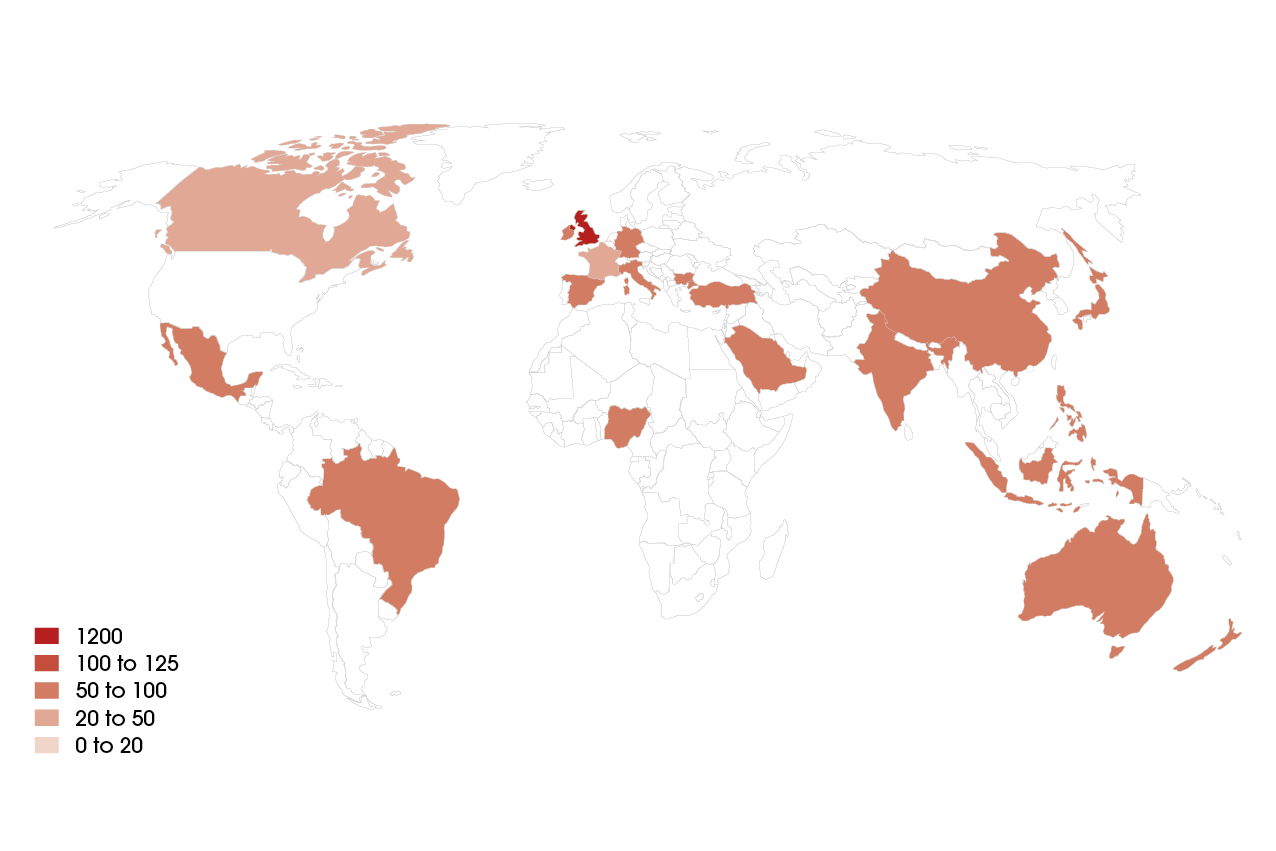
A geographical analysis of the same companies revealed that most companies are concentrated in the United States, followed by the United Kingdom. Then significant concentrations of companies exist in Western Europe, with just a few companies sprinkled in Eastern Europe, Saudi Arabia, Israel, Brazil, Mexico, Nigeria, India, China, Japan, Indonesia, the Philippines, Australia, and New Zealand. Through eliminating the United States from the geographical analysis, we can get a better sense of the geographical distribution in Figure 11, which shows Management companies worldwide, excluding those based in the United States.
Management company acquisitions were a relatively minor feature of total M&A in PropTech between 2010 and 2017, as there was an average of just one acquisition per year. Suddenly, in 2018, there were five total acquisitions, followed by four in 2019, and three in 2020. Again in 2021, we saw a large jump in acquisitions, totally eight in the fiscal year. Following these trends, we would expect acquisitions to decline in the short term, but for overall market consolidation to prove to be the long term trend.
When we examine the data of investments and investors in the Management category, our Direct Management sub-category attracted by far the most investments in the 2021-2022 fiscal year, totally $2 billion, followed by our Digitalization sub-category ($800 million), Financing ($200 million), and Communications ($100 million). Thus, within this category, we can suggest that the most significant concentrations of investment are occurring in the fields of Direct Management and Digitalization.
Figure 12 shows the top 10 business management companies that have received investments since 2021, as well as the amount invested in millions of dollars for each company. The company with the largest investment is Clikalia, whose investments totaled US$595 million between 2021 and 2022.
Figure 13 shows the top 10 companies that have invested in companies belonging to the business management category with the respective amount in millions of dollars in the years 2021-2022. We see major cross-industry market players, such as Jaws Ventures and Deutsche Bank right at the top of the list.