Overview

The global PropTech industry has experienced enormous growth in the past 22 years. The industry now covers more than two thousand companies, more than four and a half thousand investors, and 67 countries. Since last year’s report, we have seen PropTech emerge in three new countries. Of course, the percentage of companies is still predominantly centered in the United States, but we are starting to see larger and larger roles in the market played by companies in Continental Europe, China, India, Canada, and Australia.

67
countries
4
CATEGORIES
2,209
COMPANIES
4,693
INVESTORS
$108.68
BILLION RAISED (2000-2022)
67
COUNTRIES

Industry Trends

Figure 15: Global Distribution of PropTech Companies

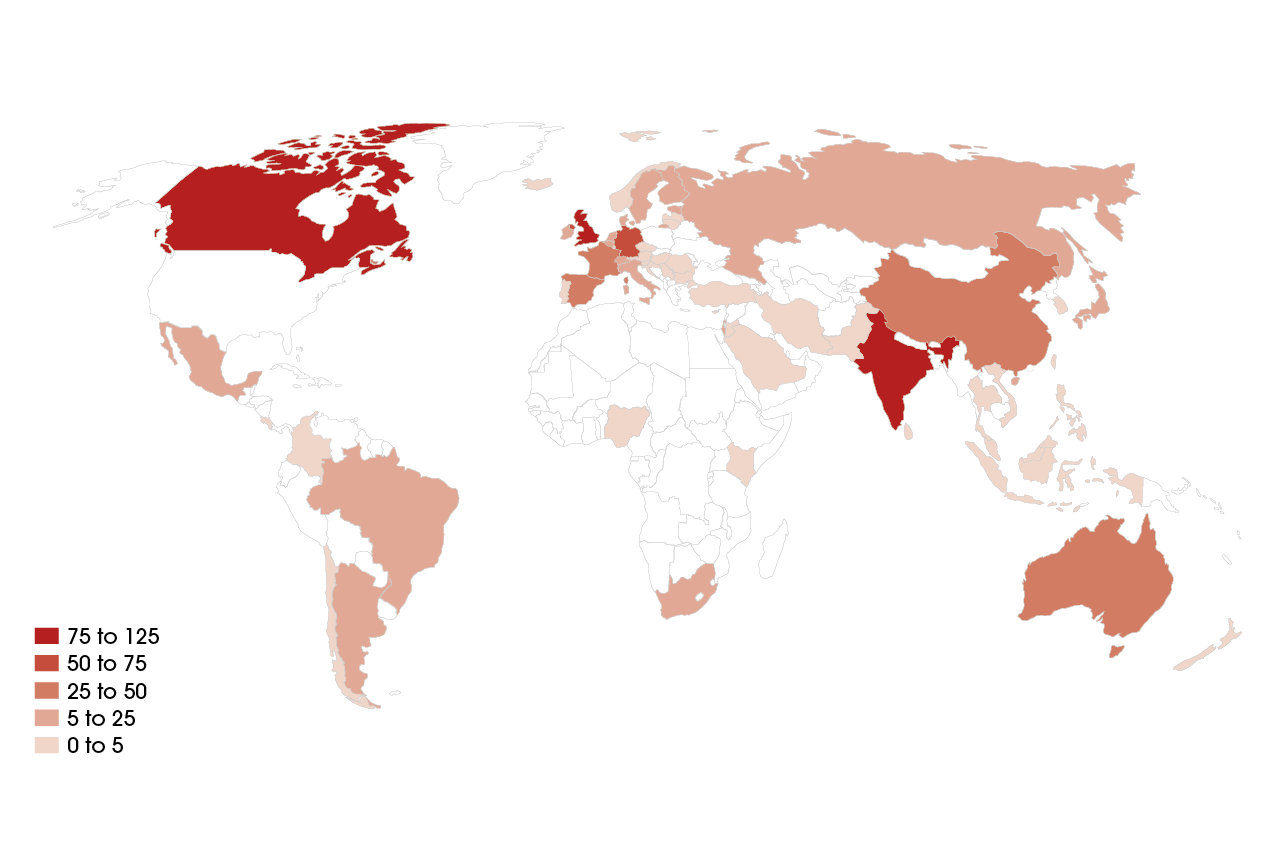
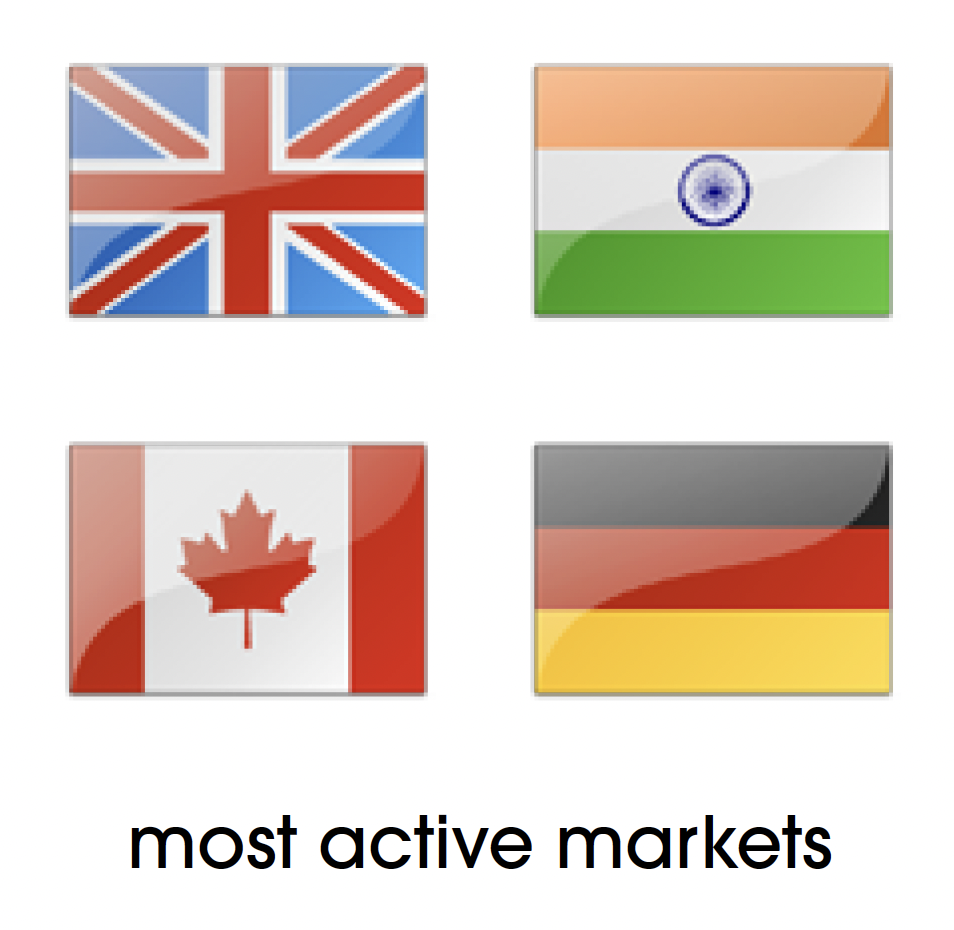
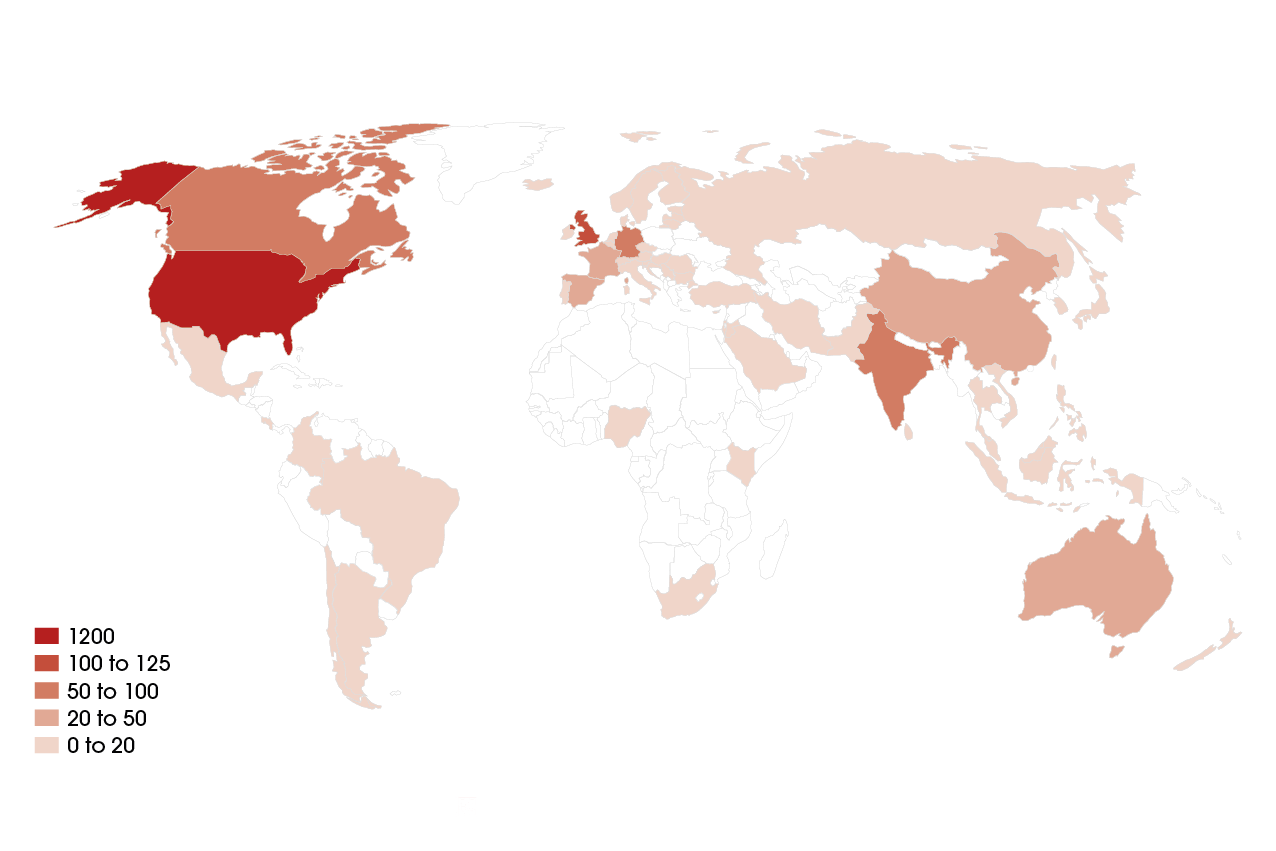
According to Figure 15, which shows the global distribution of PropTech companies, the United States is leading the change with most companies. The gap to the rest of the world is significant, with more than a thousand companies differentiating the United States from the next competing countries. The next most significant market is the United Kingdom. However, if we remove the United States from consideration, some interesting trends emerge.

Figure 16: Global Distribution of PropTech Companies excluding USA

In Figure 16, we can see the United Kingdom, India, Canada, and Germany ranking as the most prominent active markets, followed by China, Australia, and France. Even though member countries of the European Union are present on this list, individual EU states have not yet become as significant for real estate technology investment as the US and UK, or even India and Canada. That said, European countries like Germany, France, and Spain have been picking up the pace. Furthermore, European and Asian partnerships, or African and Asian partnerships, could present a significant way for this market to shift in the coming decades.

Figure 17: Top Investor Countries (2021-2022)

As home to the largest PropTech sector in the world, it is not surprising that the United States also leads the number of investors in the PropTech industry. India and the UK follow in this ranking. India and China are the countries with the most interest from investors in Asia, the vast majority of which are domestic. In recent decades, Singapore has also been a location producing a significant number of investors. However, although China and Singapore were represented in the data we analyzed on top countries by number of investors from 2000-2022, these two countries were not represented in the narrower dataset from 2021-2022.

India is the highest-ranked country outside of the established and developed markets of North America and Europe in the PropTech sector. It is relevant to highlight that homeownership has increased in India over the last few years due to a growing population with increased social mobility. India-based real estate tech companies should benefit from a flourishing home market in years to come. Furthermore, we see Israel joining the ranks due to a growth of the tech sector and Brazil emerging as a center of investors due to a combination of factors that we saw also in the case of India.

Figure 18: Investors by PropTech Company Category (2021-2022)

1087
Investors

If we take a narrow examination of 2021 to 2022 the total number of investors by category, as shown in Figure 18, both Living and Managing categories have two to three times the number of investors as the Investing and Building categories, with Managing being the top category of investors. However, if we broaden the examination to 2000-2022, to examine the long term trends, we notice that the Living category overtakes the Managing category in terms of attracting investors’ attention, while Investing and Building remain comparable. The longterm trend indicates “Living” and “Managing” categories are at least three times more attractive as measured by the total number of investors. Indeed, “Living” and “Managing” total 1087 investors and 959 investors respectively. The other two categories – “Investing” and “Building”- are not considered unpopular but attract around 300 investors each, totaling 342 and 313 investors, respectively.

Figure 19: Investment Received by Company Category and Company (2021-2022)

Figure 19 shows the relative share of investments received in each PropTech category and, within each category, the relative share of each company for 2021 to 2022. While many companies are operating in each PropTech category, only a handful of companies dominate.

This concentration of market power is very pronounced in categories with smaller overall shares. “Building” and “Investing” have no more than 3-4 major market players. LendInvest remained at the top internationally, although we also see familiar players like Divvy, Better.com, and Doma remained at the top as well. In the Building category: Katerra, EquipmentShare, Procore, and ICON dominated the market in terms of attracting investors in the past year, while companies like Bechtel Corporation and Matterport are also toward the top. We tended to find there were not as many shake-ups in the rankings in the Building category in general in long-term data as well.

In the Living category, we see companies like Delhivery (India), Huitongda (China), and Glovo (Spain) toward the top of the list. We also see Hippo Insurance, Thumbtack, and ServiceTitan. The global trend of the Living category appears to have the most negligible market concentration — in that the top 12 companies do not exceed 50% in combined market share — our data suggests the past year led to some reconcentration of investments in the United States, or at least more investment growth in the United States than in other markets.

The largest category, “Managing,” has the top five companies making up around 50% of the market share. Here, we see familiar names at the top of the 2021-2022 data: WeWork, Yanolja, Picasso, Ribbon Home, Entrata, Orchard, Vacasa, Sonder, AvantStay, and Knock. But familiar names represented at the top in the 2000-2022 measure, such as AirBnB and Expedia in the US did not perform as well in terms of attracting investors in the past year.

Figure 20: Investment Type Distribution Over Time


Figure 20 is a measure of the types of funding that companies received over time. As expected, we do not see many Series D, E, F, G, H, Venture and Private Equity sources of funding until later in the industry life cycle. However, what is most notable is that there is a dramatic growth of Series A, B, C, and Convertible Note funding in the years of 2015 through 2021, with a bit of a compression during the 2020 fiscal cycle.

We can explain this in terms of the dramatic growth of PropTech startups and diversification of the PropTech industry. Furthermore, as governments attempted to stimulate economies after the onset of the pandemic, there was simply more capital available to seed startup ventures in 2021. Although grant funding was a significant source for technology innovation in previous decades, we can see that it never really became a significant source of funding for PropTech, even when combined with Corporate, Equity, and Product Crowdfunding.

Figure 21: Investment Type by Company Age

Figure 21 shows the volume of investment funds raised by Company Age and type of funding for PropTech companies. Interestingly, on average Year seven is when a company can expect to attract the highest amount of investment, which is slightly later in the growth cycle. The amount drops off every year. This may indicate the year when a company may undertake its Initial Public Offerings (IPOs).

After this seventh year, investment in a PropTech company decreases sharply to around $1 Million, on average. This is because companies that have survived for more than 7 years tend to be well-established, well-reputed, and financially stable. Therefore, such companies typically do not need large sums of money right after the IPO. It is important to note that given the recent upsurge in the number of new PropTech companies and the recent spike in investment within this sector, any future changes to this graph would need to account for such updates to better represent the investment activity in the PropTech sector.

$1
Million average investment in a PropTech company

Figure 22: Top 10 PropTech Companies by Investment (2021-2022)

$ 21,9 Bn
Commercial Real Estate Search
USA
$ 6 Bn
Short-Term Rentals & Vacation Search
USA
$ 3,6 Bn
Property Management
CHN
$ 3,3 Bn
Short-Term Rentals & Vacation Search
USA
$ 3,1 Bn
Short-Term Rentals & Vacation Search
IND
$ 2,1 Bn
Long-term Rental / Sale Search
CHN
$ 2,1 Bn
Home Services
USA
$ 2 Bn
Long-term Rental / Sale Search
GBR
$ 1,9 Bn
Hotel chain & global booking platform
KR
$ 1,9 Bn
Long-term Rental / Sale Search
USA

Figure 22 shows the relative sizes of the Top 10 PropTech firms in the world. Alongside WeWork, we see a major Indian company, OYO is the only company with investments over $3 billion. The other Top 5 companies are LendInvest (UK), Yanolja (South Korea), and a tie between two American companies: Katerra and Equipmentshare.

In previous measures of the same data, we had seen Ke.com, a Chinese firm that is a major provider and manager of housing, including secondary housing and flats in major Chinese cities, at the top. Known as “Beike” the platform enables real estate agents to list second-hand, new property, and rentals, connecting them to prospective clients. However, we suspect market restrictions in the Chinese economy hurt the potential of the firm to attract investors. OYO, in India, is a similar user-oriented platform to Ke.com, focusing primarily on the hotel and holiday industry, connecting clients with over 23,000 hotels, one million rooms, and 125,000 holiday homes across the country.

We can see from these platforms that the technology of companies like Baike and OYO is similar to the technology of companies like Expedia and AirBnB. However, while Expedia had been at the top of our measures for total investments attracted in long-term trends, we do not see it represented at the top in the 2021-2022 data.

The UK-based LendInvest is the only European firm that has made it onto the list. The newcomer on this list is Yanolja, a South Korean company that has received $1.9 billion in investment so far. We will address Yanolja’s magnificent rise further in Chapter 4 on “The PropTech Industry by Regions.” The overwhelming trend among the leading companies in investing is the technologization of their products and processes.

This is the way of the future. We should be using technology and the power of computation to test out all of these examples, to test out a lot of scenarios, and to feed us back with the right solutions… No engineer does a high rise building without running simulations and checking the loads on every structural element. PropTech is providing the tools for architects and for engineers; the tools for those that drive good decisions.

Dr. Benjamin Coorey - CEO of Archistar