I’m a big believer in the idea that technology can be a force for good. If we harness it, activate it, and thoughtfully iterate, we can apply technology to solve any number of challenges.

As an entrepreneur, I see the following: you have facts, and then you have fiction, also known as a dream. Between facts and fiction, you have belief. To be a successful entrepreneur, you have to believe that you can turn your dream into reality, more so than anyone else, and it can be lonely. And then you have to be relentless in your pursuit to prove it. Then what used to be considered fiction becomes fact.

Dr. Rao Mulpuri - CEO of View

Overview

This chapter focuses on projections for the PropTech industry in the fiscal year 2023. Our primary hypothesis is that leaders in PropTech will continue to be perseverent. In the previous chapters, we examined the patterns and trends in the recent and distant past. That analysis set the stage to get a glimpse of what we can expect to see in the fiscal year 2023. This means that the year 2022 represents the time period from June 1, 2021 to May 31, 2022. Similarly, the year 2023 represents the time period between June 1, 2022, to May 31, 2023.

Before we move onto the trends in the projections, we briefly explain the process of making these projections. We used past data on the investment made in each PropTech company starting from the year 2000 up until June 2022 to make these predictions. We observed the investor identity, its region, along with data on receiving company identity and its region. We also used information on the type of investments that were made in the past along with the date of that transaction.

We combined all these data and put a time series structure on it. Next, we used machine learning to predict the investments at the transaction level for the year 2023. Finally, we aggregated the predictions at the company category, year, and countrylevel to show these aggregate trends. These are baseline projections expected given the past trends of investment. If something extraordinarily unexpected happens in the year 2023, the projections may change to some extent.

Investment

Figure 33: Predicted Investment by Category (2022 – 2023)

What we see from our models is that we expect an overall decline in investment across all four categories of PropTech for the 2022-2023 cycle based on year-on-year comparisons. Our model predicts an Investing category decline from $5.69 billion to $4.26 billion, representing a decline of about $1.43 billion, or around 25%. Similarly the Managing category is predicted to decline from $6.57 billion to $5.17 billion and the Living category is predicted to decline from $6.15 billion to $4.82 billion. The Building category saw the least decline in our predictive modeling, with a just $.17 billion decrease from 2022 ($1.86 billion) to 2023 ($1.69 billion), or around 9%.

2022
$5.69
BILLION
$6.57
BILLION
$6.15
BILLION
$1.86
BILLION
2023
$4.26
BILLION
$5.17
BILLION
$4.82
BILLION
$1.69
BILLION

Therefore, while the Building category saw the least investments, it also saw the least declines. Given the market outlook, and because the Building category is more driven by raw-demand for housing and work-spaces, we expect that any future declines would not be as substantial in this category, if the pattern holds. While investments in Managing and Living companies will likely decline by a substantial amount in any future market downturns, they are still not as dependent on raw capital as the Investing category. Thus, we expect PropTech investing companies to absorb the greatest market impacts from any slowdowns during the 2022-2023 business cycle. We might also consider how this will impact the Real Estate sector, in comparison to other sectors of the economy.

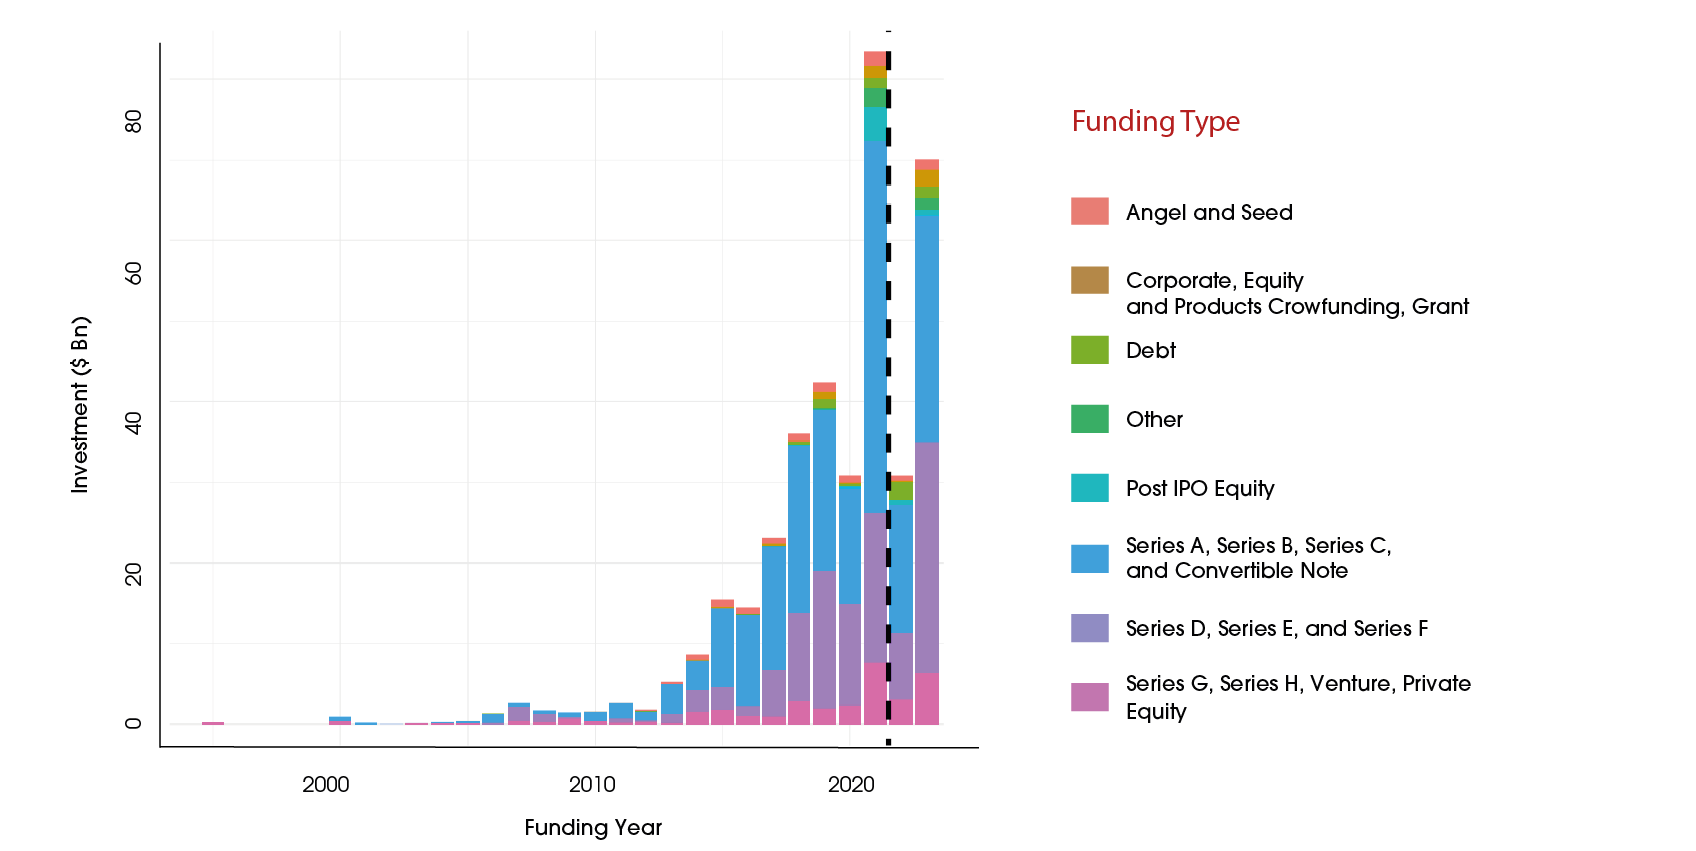
Figure 34: Amount of Investment Projected for 2022-2023


Our projections in the type of investment for 2023 also show long-term trends of slight decline, when compared to the highs of 2021. We should remember that many countries injected capital into European and American economies during 2020, in an effort to restart their economies after the pandemic lock-downs. The result was an enormous jump of capital available in the market and in various types of investments in 2021. However, by 2022, inflationary fears and other market factors have contributed to an overall pull-back in spending that is also reflected in our projections data. Some stabilization of the market as a whole should result in a “return to normal” for investors. That said, if we compare the data to the 2019 and 2018 fiscal year projections, what we see is a long term increase, resulting in more than $60 billion invested in PropTech projected for 2023, with particularly strong growth in Series A, B, C and Convertible Notes funding as well as Series D, E, and F funding.

Figure 35: Projected Investment 2023, Country of Origin

When we measure our projections for the investments in terms of country of origin, we expect to see certain predictable players rising to the top. The U.S. is projected to be the country of origin of $208.65 billion by 2023. Far behind the United States, Great Britain is projected to be the origin of $3.47 billion of PropTech investments. Our other players are much smaller: with Germany ($694 million), Australia ($455 million), and Japan ($415 million) rounding out the top five. For the remainder of the top ten, we expect to see Switzerland, Israel, China, France, and Canada all remaining significant countries of origin for PropTech investments. Of note: almost all of these countries are also increasing specific incentives related to addressing climate change in ways that will also stimulate growth in the PropTech industry.

The US are projected to be the origin of $208.65 billion PropTech investment by 2023

Figure 36: Projected Investment 2023, Country of Destination

Among the notable trends in PropTech investment, we were able to create projects for the country of destination for new investments for 2023. Notably, these projections are much lower than our total investments by country of origin measures, because we are measuring only external investments. Nonetheless, what we are expecting is that investments ($401.74 billion) will move toward The United States in 2023, where markets are high value and offer substantial returns. Great Britain will be a country of destination of substantial ($5.905 billion) investments.

$401.74
BILLION
projected investment for 2023 in the US
$5.905
BILLION
projected investment for 2023 in the UK

The next major player for destination countries may come as a bit of a surprise: India ($1.963 billion), South Korea ($1.493 billion), and Spain ($990 million) round out the top five. However, it is important to note that PropTech is clearly making waves in each of these three countries. India has long had a notable start-up industry and has been a producer of top talent for decades in the tech world. South Korea emerged as a major player in the Pacific Rim by the 1990s and has more recently become the hub of Yanolja, one of our top performing companies in the world for the 2022 PropTech Barometer. Finally, companies in Spain have also been making waves aiming to increase investments in PropTech. It is also exciting to see some new countries on the top ten list. While we might expect Germany, Austria and China to land in the top ten, Brazil and Colombia represent new burgeoning markets for PropTech companies in South America.

$1.963
BILLION
$1.493
BILLION
$990
BILLION

Overall, the declines in investment we project must be taken in stride. Clearly there are also new opportunities for PropTech investors in this dynamic market. The trends remind us of the advice of Dr. Rao Malpuri, CEO of View, “The key is to be perseverant,” which is important advice to keep in mind for our final case study.

Case Study 1:

IoT, Buildings & Expectations of Paris by 20503

Our team’s final case study this year focused on the global goal of decarbonization by 2050. This case study examined the use of the Internet of Things (IoT) technology as a means to optimize construction and maintenance of green buildings in the field of PropTech. More specifically, the study examined how IoT technologies could be of use for retrofitting buildings to upgrade existing buildings. Focusing on two IoT companies in the U.S. residential sector and examining two different scenarios :

  • 1) the increase in activity projected in the next 30 years without mitigation measures.
  • 2) the implementation of the Net Zero Emissions (NZE) agenda timeline of 2050.

Between current status and NZE goals, Nationally Determined Contributions (NDCs) are used to set stepping stones to realistic decarbonization.

Figure 37: US Residential Sector’s Expected Carbon Emission Evolution if NDC & NZE Goals are 100% Fulfilled

Figure 37 demonstrates a visual representation of the U.S. residential sector’s expected increased carbon emissions and what is needed to decarbonize the U.S. market in the next three decades. This data relied on a compilation of projections in numbers of households in the United States, NDC and NZE goals established by 2005 data.


3 In collaboration with Coralie Vergerolle, as part of the ESCP-Monaco Real Estate Technology Innovation research program. A more in extended analysis of these trends was submitted for degree requirements in the Bachelor in Management program at the ESCP Business School.

Carbon emissions in 2020 are used as a baseline for this case study, as measured in GtCO2. Then the increase in number of homes projected between 2020 and 2030 was calculated, resulting in a net increase of +15.2% GtCO2. Thus, the necessary decrease to meet NDC goals in the U.S. would result in a -42% decline in GtCO2, or .615 GtCO2 by 2030. Furthermore, the number of homes is expected to cause carbon outputs to increase again by +16.5% between 2030 and 2050. Thus, the changes required for total decarbonization by 2050 will still be significant.

+15.2%

The timelines in this case study thus assume that all new buildings must be zero-carbon ready by 2030, while 50% of existing buildings need to be retrofitted to zero-carbon levels by 2040, and more than 85% of all buildings would have to be zero-carbon ready by 2050. This is where IoT technologies come in.

85%
zero-carbon ready by 2050

IoT technologies play an important role in creating adjustments to the normal use of home appliances, reducing inefficiencies. Most energy consumption in homes is taken up by space heating, followed by water heating, air conditioning, lighting, and refrigeration, respectively. However, a significant portion of U.S. energy consumption in homes, more than 20% – is also taken up by “other” types of energy consumption.

It is important to remember that some types of energy saving measures, such as electric vehicles, might increase “other” types of energy consumption in the home. This does not negate the positive impact of adopting electric vehicles, but rather presents a new problem that IoT technologies might be able to solve. While technologies will have to be implemented incrementally to the building sector, in accordance with the Paris Agreement, adopting IoT technologies in the field of PropTech could introduce important ways to cut costs, improve efficiencies, and make some financial gains.

20%
other types of energy consumption

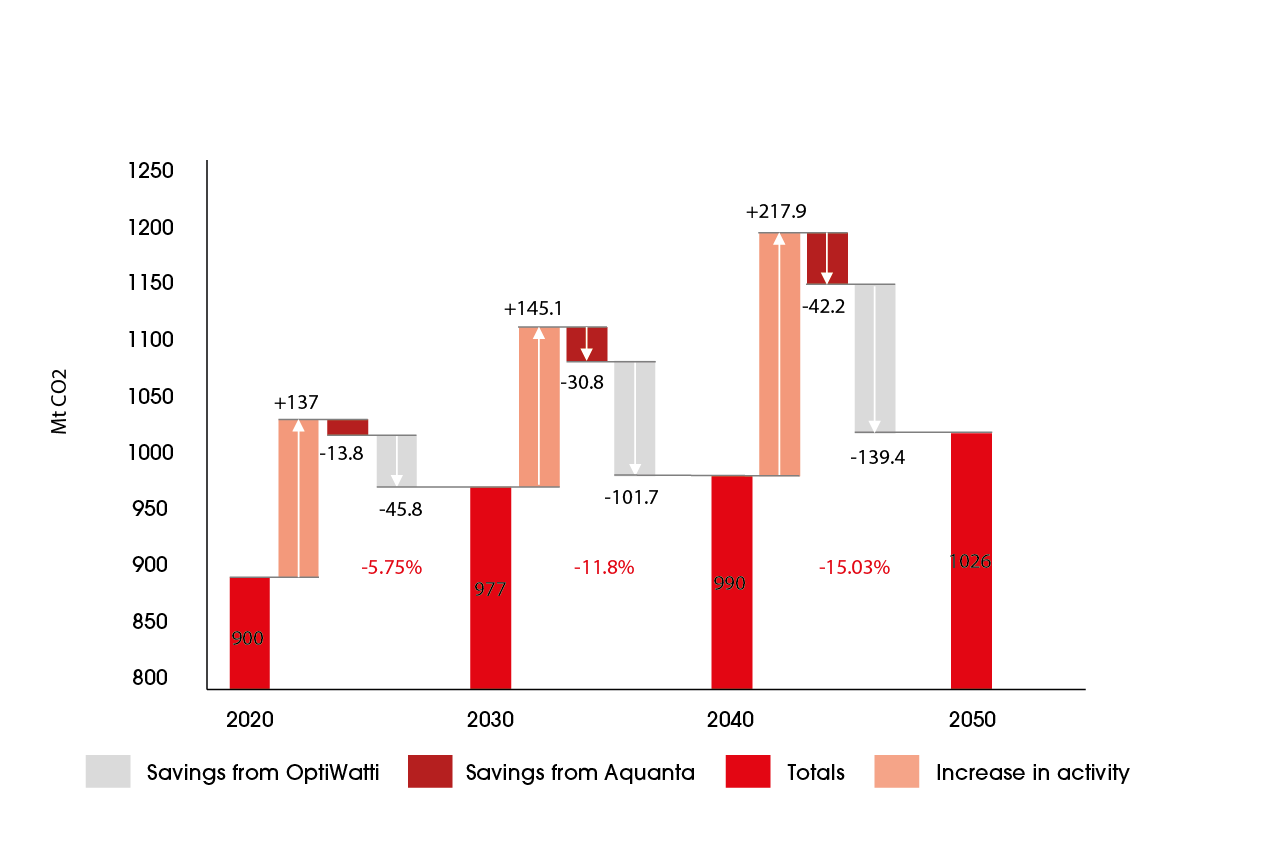
Figure 38: Potential Savings using Aquanta & OptiWatti Technologies (2020-2050)


In this case study, two key IoT technologies were compared to illustrate the total possible savings of carbon outputs in the U.S. residential market. Importantly, the case study shows that we cannot entirely offset the expected growth of carbon outputs measured in MtCO2 between 2020 and 2050 using these two technologies alone. Nevertheless, they do represent two successful offset measures. The first IoT technology is Aquanta.

Aquanta is a smart electric and gas water heater controller. Because water heating makes up the second largest portion of carbon outputs produced by the US residential market, Aquanta was identified as a potential technology to adapt to NDC and NZE goals. Aquanta is therefore an important technology to adopt to treat an existing problem in the market.

Optiwatt is a bit distinct from Aquanta, in that it specifically addresses a distinct problem of emissions that is predicted in the future. Currently, EV charging stations do not represent a major share of the energy consumption of US homes. However, as electric vehicles are increasingly adopted as a carbon saving measure and fossil fuel dependent vehicles are phased out of the market, Optiwatt addresses a problem of the future. It is a forward thinking solution for the market.

Indeed, the case study showed that while Acquanta could account for incredibly significant savings of MtCO2 outputs (13.84 by 2030, another 30.753 by 2040, and another 42.15 by 2050), the projected savings through adopting Optiwatt now are even more significant. Across these two technologies, the projected growth of carbon emissions is not completely reduced, of course. However, it is significantly stabilized.


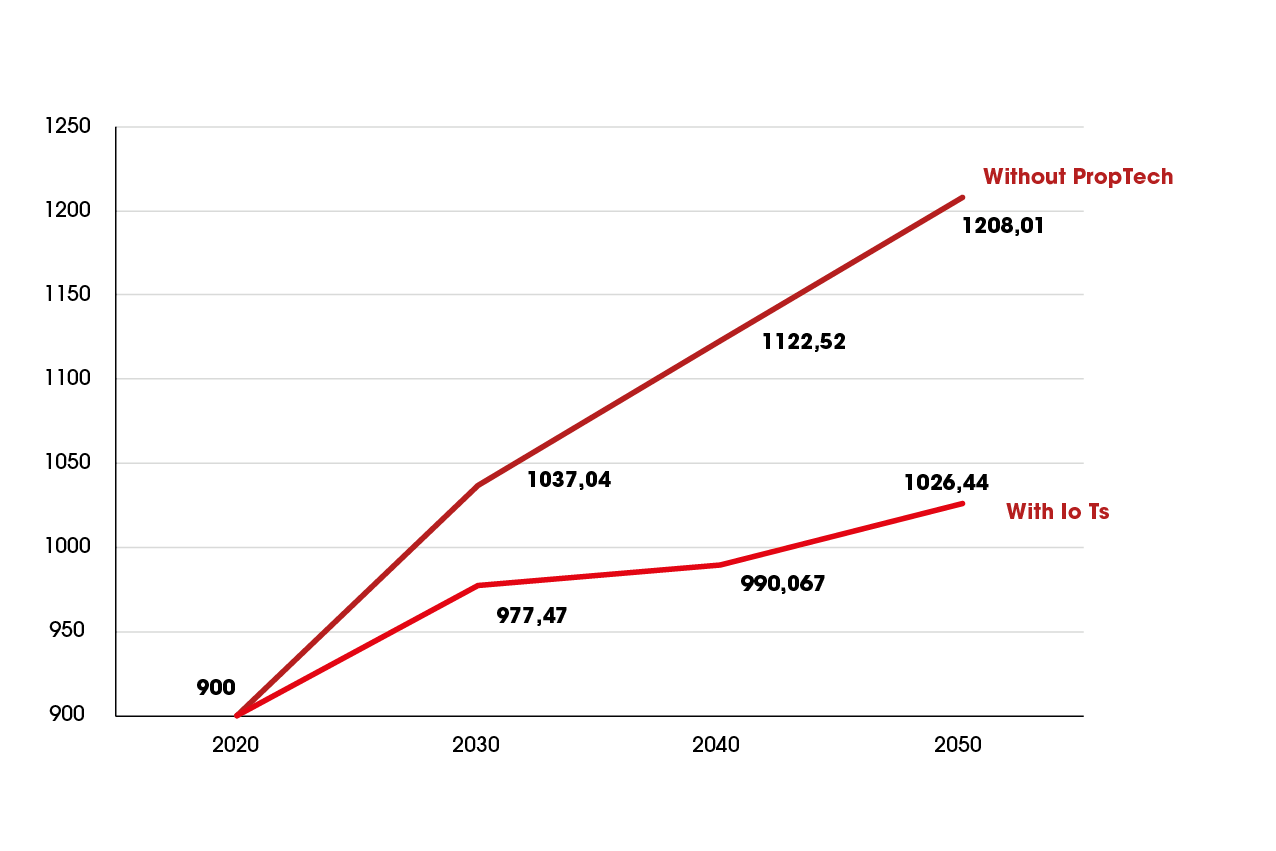
Figure 39: Comparison of Carbon Emissions in the US Residential Sector (2020-2050 Projections) with and without IoT


Overall, it is clear that an adoption of a wide variety of IoT technologies in the PropTech sector is key for the future of Real Estate markets. Real Estate markets must address the realities of climate change to remain profitable and PropTech is providing solutions. Figure 39 shows the nature of carbon emissions projections for the US residential market. Clearly, without the contributions of IoT, the market will continue to have increased carbon emissions.

We might expect the carbon emissions to be accelerating. However, the nature of increased regulations and adoption of green construction technologies will provide for some deceleration of carbon emissions in our model. That said, this deceleration is made much more significant through the adoption of IoT contributions to efficiency problems. Simply put: IoT’s reduce inefficiencies and therefore reduce excess consumption of energy. Overall, the case study shows that there will still be a net increase of 14.08% with IoT by 2050. However, the contribution of IoT is also a reduction of -20.14%. Clearly, the path forward for the global community is through PropTech.

+14.08%
net increase of CO2 emissions with IoT by 2050