4
CATEGORIES
2,177
COMPANIES
3,437
INVESTORS
$42.135
BILLION RAISED (2022-2023)
80
COUNTRIES

Overview

The focus of Chapter 2 follows recent developments in the PropTech industry during the June 1, 2022, to May 31, 2023, fiscal year1.

We cover an overview of the year, breakdown the four categories of PropTech and subcategories considered in this report, and then give a detailed fundraising update for 2023. Next, we discuss top investors and investment trends, before covering mergers and acquisitions and concluding with an assessment of the top performers for the 2022-2023 fiscal year.


1 As with all data in the 2022-2023 Annual PropTech Barometer, we rely on Pitchbook as a data source. Although we relied on Pitchbook to help us filter the data, all graphs and images generated are our own.

2,177
companies

At the end of the fiscal year 2022-2023, 2,177 PropTech companies were in operation in the PropTech industry around the world. Over the past half-decade, the sheer proliferation of PropTech companies has compelled us to consistently reexamine our understanding of this vital industry. Our data this year suggests projected contractions in PropTech companies resulting from market consolidation, as well as a dramatic decline in investors. At the same time, the amount of money raised during this fiscal year alone is quite a bit more than last fiscal year. Still, a year-on-year comparison within our dataset based on calendar years tempers these results, suggesting the amount PropTech companies raised declined slightly when compared to the previous calendar year. Furthermore, with PropTech markets emerging in more than ten new countries makes the list of PropTech markets more diverse than in previous years, the data on the leading markets remains consistent, providing for a few shake-ups in the rankings.

First, we should consider the possibility that our data is improving in quality from year to year. We are likely able to capture more and more small companies that just exist for a single cycle or slightly more before being acquired than we were in the past. However, we are also likely to have better data on these small companies being quickly acquired than in the past. Relatedly, our data on companies outside of the United States and Western Europe is also probably improving, meaning we probably have an even better understanding of the global dynamics of this industry this year. We expect these trends of improved datasets to continue as time goes on.

Second, we should consider the possibility of industry growth to help explain the growth in capital raised in the second half of the 2022 calendar year and the first part of the 2022-2023 fiscal year. As we will demonstrate in this year’s barometer, we do have very real evidence of substantial growth in the PropTech industry. This growth comes despite the economic challenges of rampant inflation, military conflicts involving global superpowers, and uncertain business conditions in the context of recovery from the global pandemic and the pressing challenges of climate change.

Third, we should consider the possibility that some of the major jump in funds raised by PropTech companies is essentially “sponsored” by large transnational investor firms and influential VCs coming around to see the reality that PropTech is a critical industry for the future of business. We will also detail the degree to which we find evidence for this explanation when we examine the “investors” category in more detail.

Four Categories of PropTech Companies

As we have revised our methodology for examining PropTech companies in this new climate, we divide the companies into four critical categories, based on their primary relation to the property life-cycle. These categories are Building, Managing, Investing, and Living, as explained by the table below. We have discussed the nature of these categories in depth in our previous PropTech Barometers (including the 2020, 2021, and 2022 editions).


This year, thanks to an enriched dataset, we are also providing information on a new form discussing company categories, called an “Industry vertical,” which discusses how companies cater their specialized services and products to a particular target audience within a specific niche in the market. The verticals that we consider are “Financial Services,” “B2B,” “B2C,” and “Information Technology.” Importantly, although it is possible that a company in the “Managing” category may also engage in “Investing” — as exemplified, for instance, by the number of managing companies exploring various forms of iBuy investing – we sort these companies into categories on an exclusive basis based on their primary relation to the life cycle of a given property. Similarly, while it is certainly possible that a B2B (Business to Business) company may engage in software development and providing IT services, our dataset sorts these companies exclusively, based on their primary Industry vertical.


Readers familiar with last year’s barometer may remember our “Investing, Building, Managing, and Living” categories, which captured significant features of the market based on the way that these companies shaped interactions with “property” itself. Investing companies invested in property, building companies built it, managing companies managed it, and living companies facilitated living in it. However, as previously suggested, it is increasing difficult to categorize some companies, especially those engaging primarily in software development for products used across the life-cycle of a property, or financial services, including new models of co-financing whereby these companies are engaging simultaneously in both the Managing and Investing aspects of our previous categories.

Needless to say: each path and method of analysis has its advantages. We hope our current method of utilizing company categories, while providing enriched analysis by industry vertical helps readers more clearly categorize how PropTech companies are providing services to the market as a whole, a slightly different emphasis than last year. To keep it simple, Financial Services companies provide support for any possible form of financing. B2B and B2C companies are companies shaped by the way they interact with clients, as businesses and consumers, respectively. Finally, Information Technology companies are those that are primarily involved in the creation, processing, storage, and analysis of data.

2023 Fundraising Update

Figure 1: Total Capital Invested in PropTech, Calendar Year 2004-2023, Including 2023 Projections


60.30
Billion USD

Although PropTech is an entirely unique industry, we begin by highlighting some ways that PropTech tends to follow market trends, to better understand how the PropTech industry also diverges from these trends. To begin with, we can see that the overall trend of total capital invested in all forms of Property Technology, Mortgage Technology and Construction Technology is relatively small in the early years of the tech boom, with initial slight declines in 2008, and a bumpy initial road to recovery, with growth years in 2009, 2011, and 2014, while 2010, 2012, and 2013 experienced slight declines in investments. However, by 2015, the PropTech industry took off. Although the actual deal count was seemingly impacted by the COVID 19 pandemic, as growth slowed from 2,344 in 2019 (+296) to 2,484 in 2020 (+140), the capital invested still grew, from $48.50 Billion USD to $60.30 Billion USD. With 715 deals involving 689 companies and 11.06 Billion Pounds totaling investments from the first five months of 2023, a simple adjustment for the rest of the year suggests there will be fewer investments and deals by the end of the calendar year, when compared to the past years where large capital injections bolstered markets.

Massive cross-sector cash flows continued to increase in 2020 through 2021, in part because the reduction of interest rates to practically zero made cash cheap and in part because injections of capital into the market from central banks increased the flow of cash available to investors. By 2022, as central banks began to increase interest rates, inflation reached staggering levels, and global geopolitical conditions worsened, we saw declines in investments in PropTech much like in every other sector. However, these declines did not hit PropTech the hardest out of all technology industries. Even still, if the patterns from the first several months of 2023 continue to hold, we can expect a continued element of post-pandemic economic recovery, providing a silver lining within a cloud of continued market uncertainty. Although this long-view matches the big picture across industries, we will also see how PropTech is positioned to perform better and assume less risk than some notable competing industries throughout this year’s Barometer.

The big stories in early 2023 impacting investments across tech sectors were the failures of a series of mid-range banks, including SVB, Credit Suisse, and First Republic, all of which were invested in varying forms of technology sectors. The failure of SVB, naturally, hit the FinTech sector hard, while the failure of Credit Suisse hit biotech. We explore these difficulties through a difference in differences comparison in Case Study 1. Case Studies 2 and 3 then focus on two key overlapping subsectors with PropTech, Mortgage Tech and Construction Tech, shedding light on the performance of companies that deal more directly with financial transactions and companies that deal more directly with physical materials, so that readers might contrast the two foci with a third in our fourth case study. Our fourth case study this year, then, deals with the way that PropTech is working to address the most pressing issue of the 21st century, through its intersections with Climate Tech. After these case studies, we move to the meat and potatoes of this year’s PropTech Barometer, addressing the Global PropTech industry (Chapter 3) and explorations of the PropTech industry by region (Chapter 4) before turning to our comparison of competing industries (Chapter 5) and future projections (Chapter 6).

Top Investors & Top Investments

Figure 2a: Top Investors by Total Investments as of 2022-2023


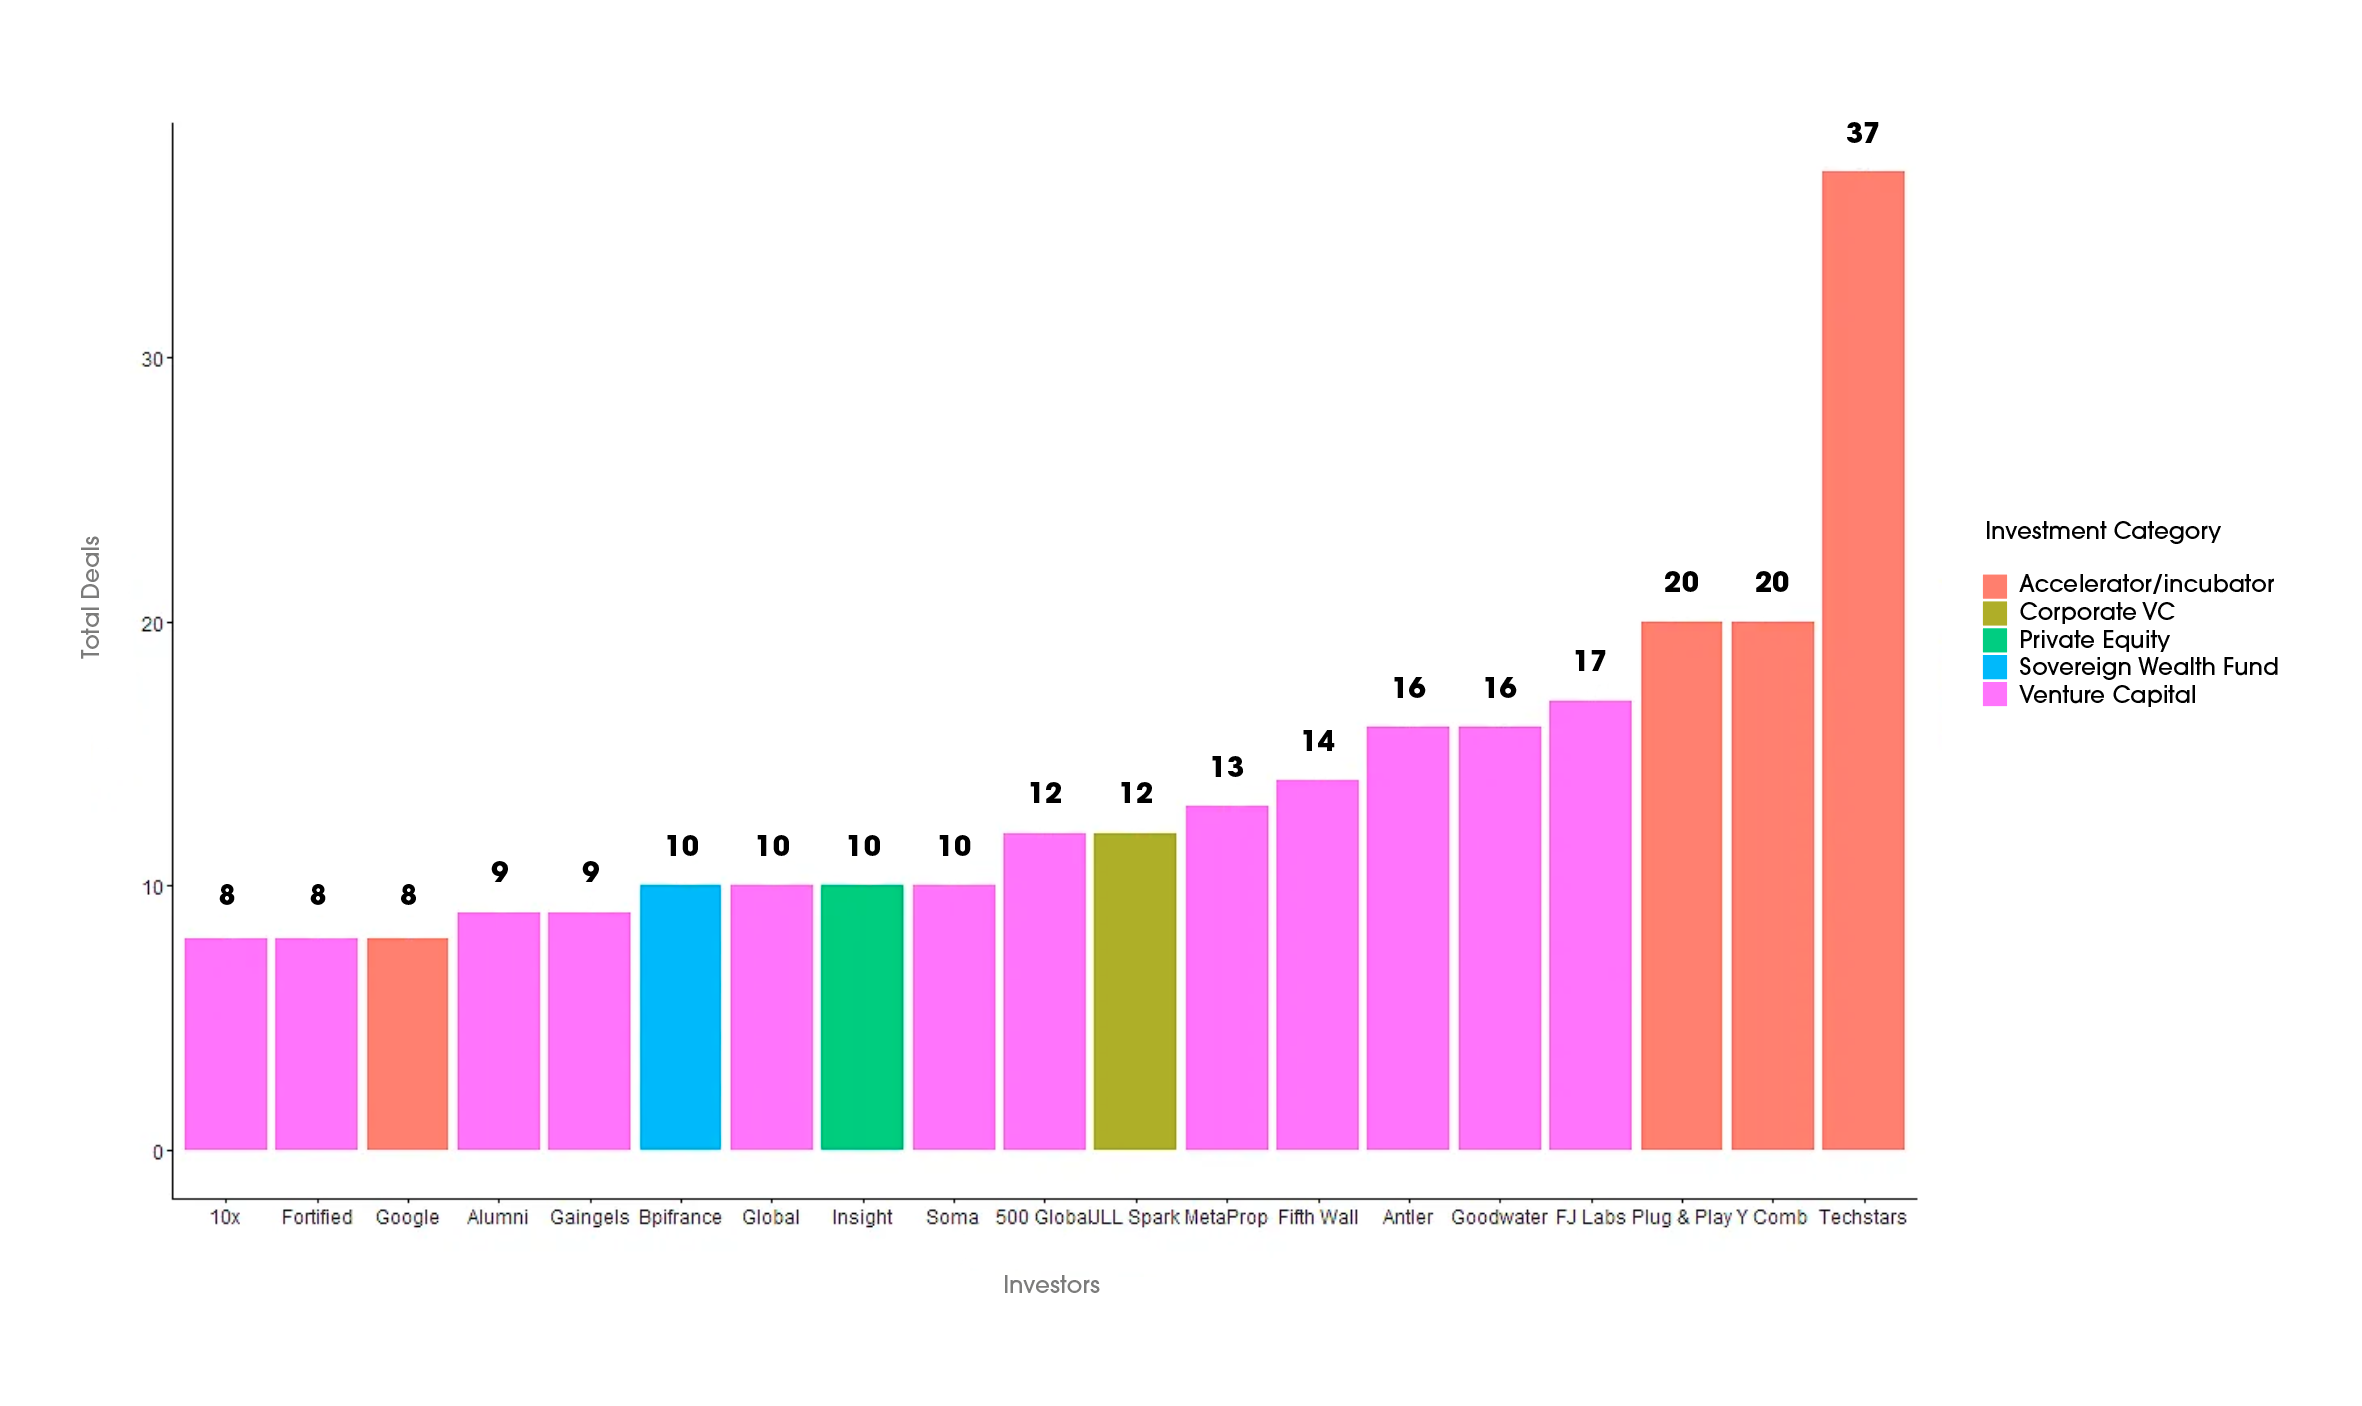
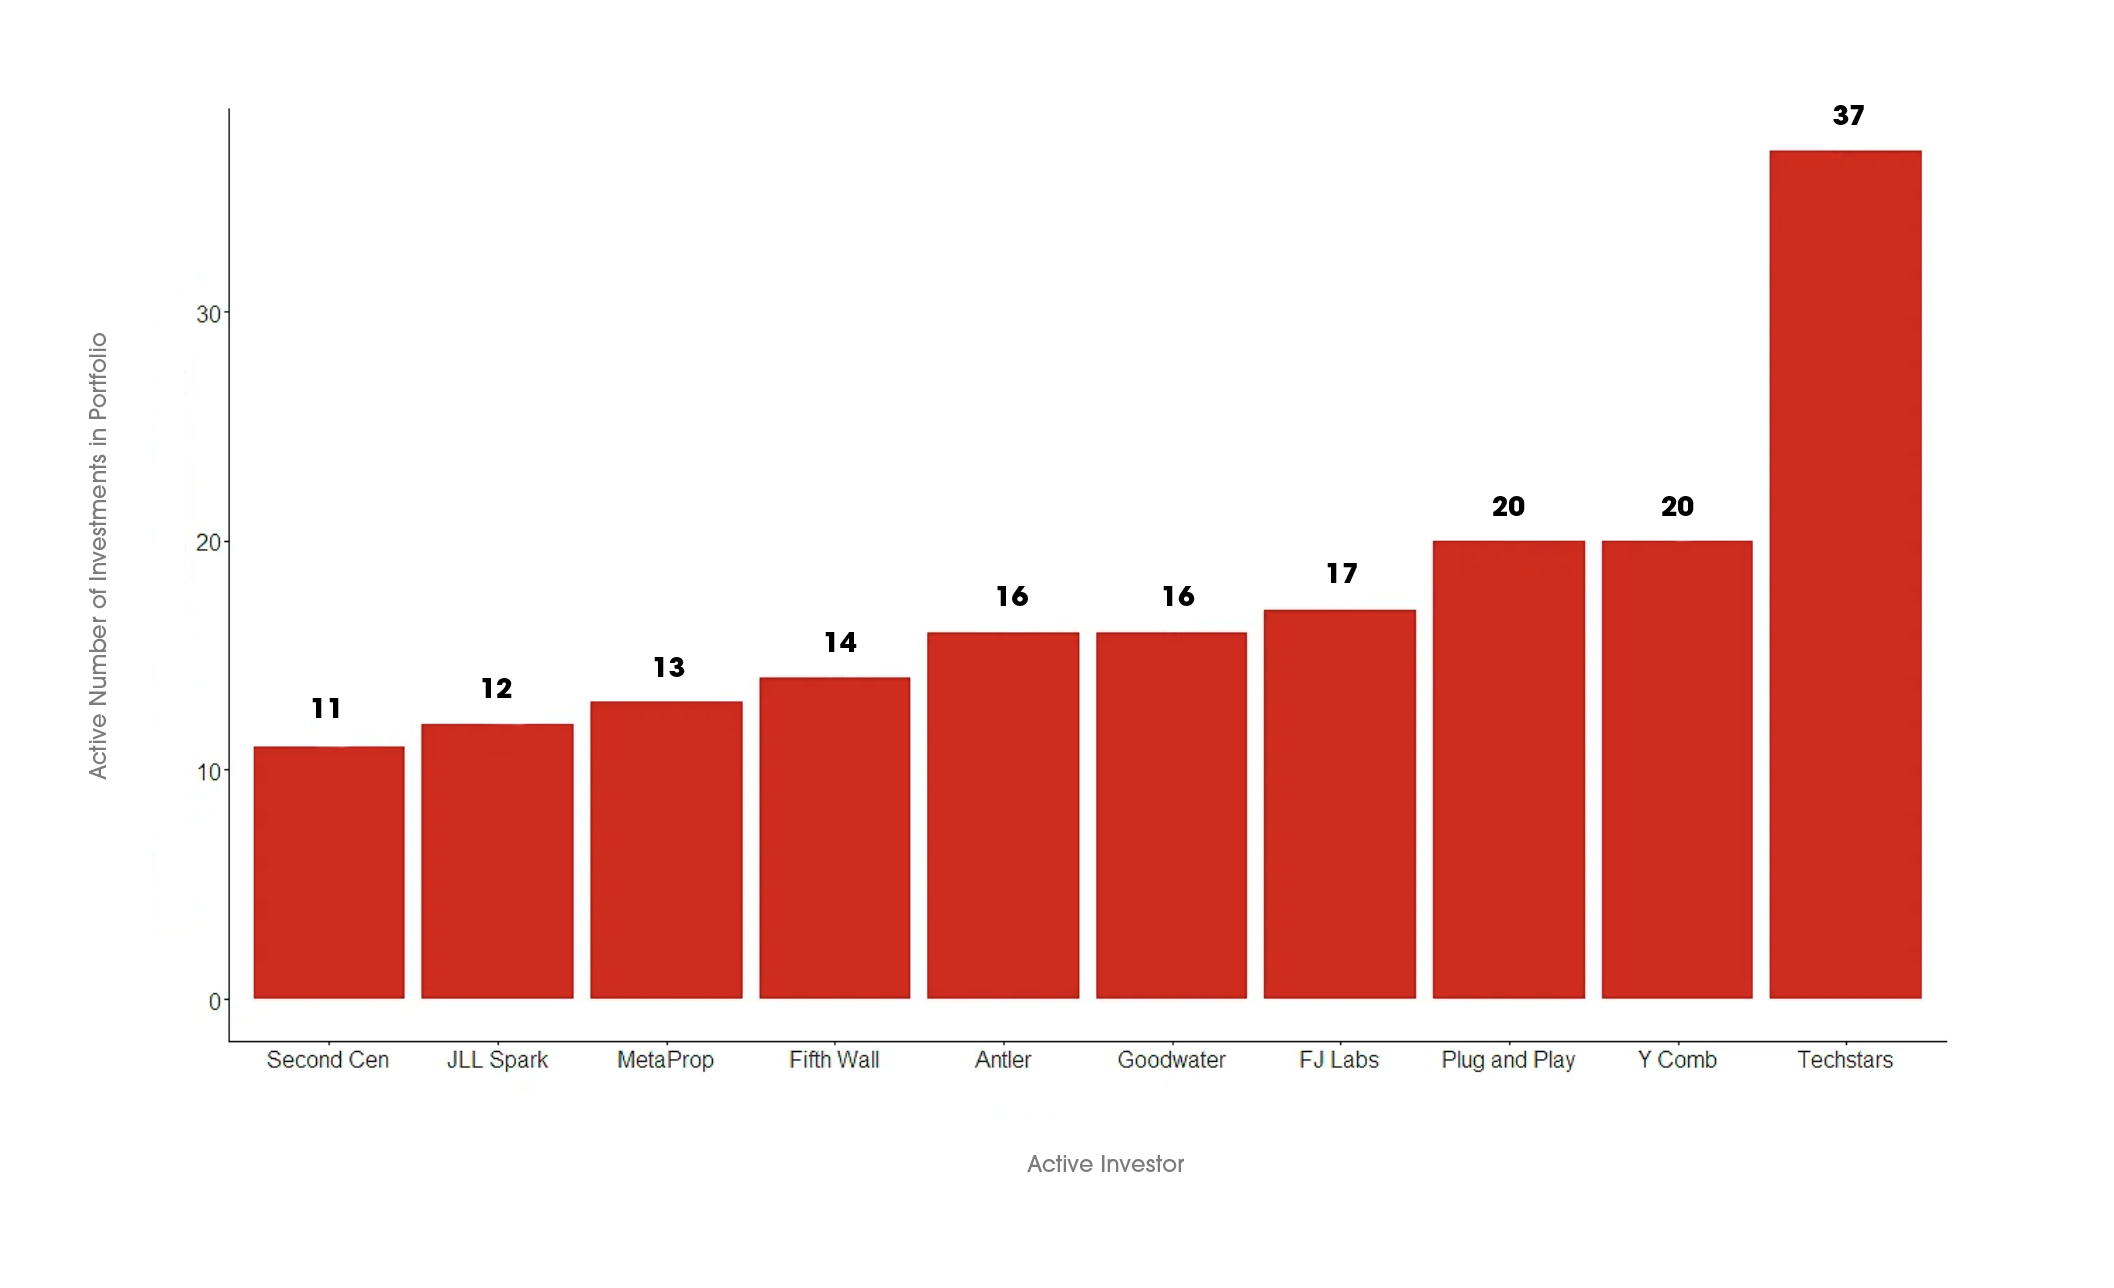
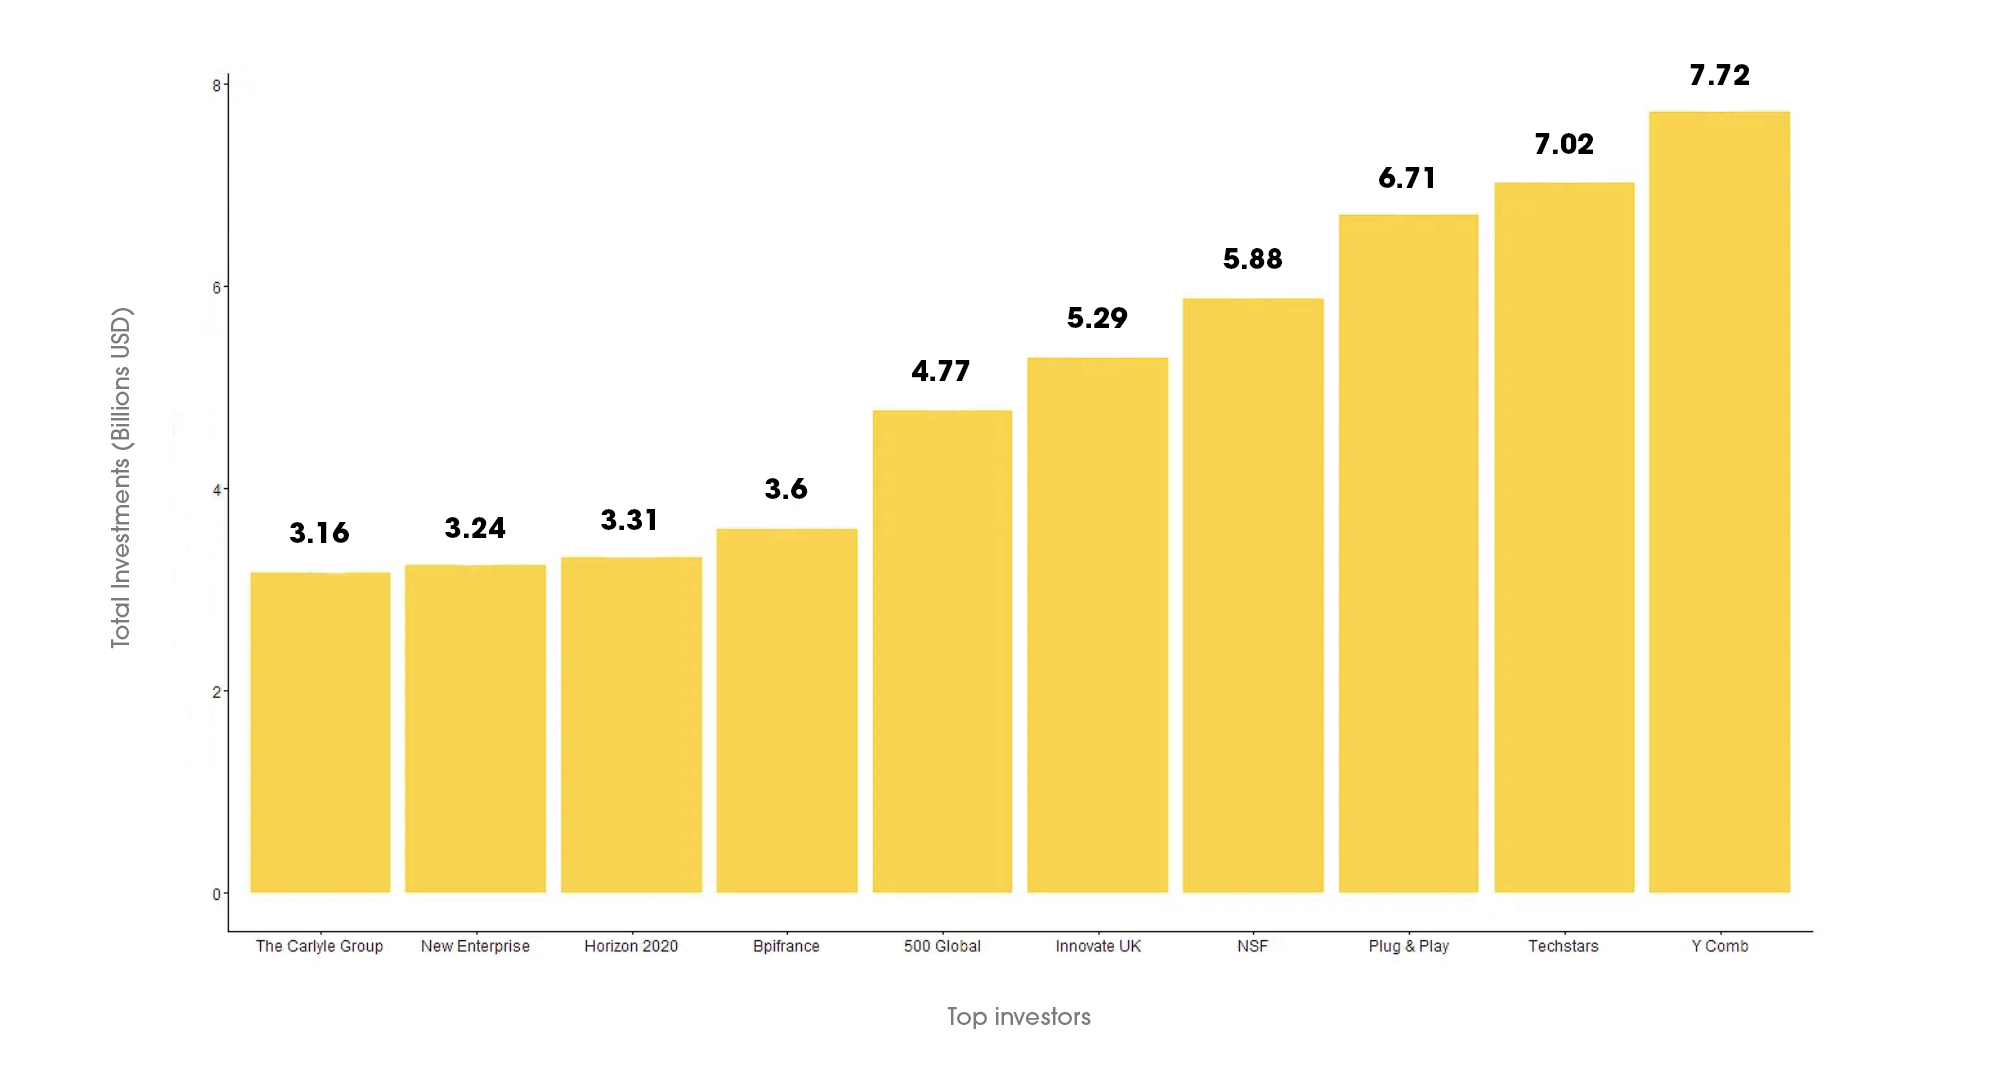
If we rank the top investors who participated in deals in the past year by the total number of their investments over the lifetime of their firm as of 2022-2023, we have an informative picture of the top players of the PropTech industry. Unsurprisingly, because of their long term position and access to capital, government funded ventures through the National Science Foundation in the United States, Innovate UK, and Horizon 2020 SME Instrument in the European Union are on the list of the top ten investors in terms of their total number of investments over time. However, most of these groups have not been very active in the past 12 months. Horizon 2020 SME instrument is mostly no longer active, having participated in just one deal in the past 12 months, while Innovate UK and the NSF participated in just five and three deals respectively. The other top ten players represent a mix of PE/Buyout (Enterprise Ireland), Sovereign Wealth Fund (Bpifrance), and Venture Capital (New Enterprise Associates and 500 Global). Bpifrance and 500 Global ranked in the top twenty most active investors this past year but just missed out on the top ten. Nevertheless, the cream of the crop remains three accelerator/incubator firms, Y Combinator, Techstars, and Plug and Play Tech Center, all three of which are also on the top ten list for most active investors this past year, along with the top ten investors for the year in terms of total investments. In other words, the most active investors are those that specialize as either accelerators or incubators.

Figure 2b: Top Investors by Number of Investments for 2022-2023


Image 2b shows the top investors in PropTech in the past year by raw number of investments. Unsurprisingly, major players in the startup landscape like Techstars (37), Plug and Play Technologies (20), Y Combinator (20) and FJ Labs (17) are at the top of the list. As a measure of the activity of these top players, FJ Labs had more than twice the number of deals as Google, Fortified, and 10x this year, which took the number twenty, nineteen, and eighteen spots in this year’s rankings. However, the data also shows a relatively diverse subset of midrange players, as measured by frequency of activity, who were very active in the last year, including Goodwater Capital, Antler, Fifth Wall, MetaPropNYC, JLL Spark, and 500 Global. Then, although they didn’t quite break into the top ten, we have a diverse list of second tier players, including Soma Capital, Insight, Global Ventures and BpiFrance, each with ten deals. These were followed quite closely by Gaingels and Alumni, who had nine deals each, along with Google, Fortified, and 10x, who each had eight deals.

Going to market is probably the main challenge for PropTech startups. It’s very difficult to navigate the space populated by companies with 100,000 personnel. You need a translator. You need someone who can help with connecting the right people in the industry and also with connecting you to the right clients, the ones that are ready to deploy technology solutions.

Tanguy Quero - Investment Principal, JLL Spark - JLL Spark is the investment arm of JLL, which is committed to transforming the real estate industry through technological innovation

It is not surprising to find JLL Spark, which specializes in earlystage PropTech startups, MetaProp, which claims the world’s largest early-stage PropTech portfolio, along with Fifth Wall, which claims to manage the largest global fund specialized in Real Estate Technology, appear in solid positions on this list. However, Soma Capital is primarily a FinTech investment venture, and Techstars is a cross sector operation emphasizing technology investments. The repositioning of these very active investors flags an increased interest in PropTech from the broader sector of technology investors, suggesting some of these investors might be seeking both rapid growth opportunities and relatively more stable long-term investments, both of which are made possible with the advances of the PropTech industry.

Figure 3: Top Investment Receiving Companies by Single Deal (2022-2023)


The top 10 investment receiving companies, as measured by deal size of their single largest deal, reveals critical characteristics of the PropTech market from the past year. Four of the top ten deals were major acquisitions. The most significant being the Healthcare Trust of America deal where Healthcare Realty Trust led the acquisition of the former, merging two of the largest providers of commercial healthcare real estate in the United States. While both companies operate as Real Estate Investment Trusts, leveraging Big Data and Analytics to make sound investment decisions, Healthcare Trust of America was also an owner and operator of medical office buildings, which made use of numerous technologies for their operational management. In the second most significant acquisition, Better.com acquired Aurora Acquisition – a blank check company established for the purpose of effecting a merger – through a reverse merger (as of March 9, 2023). The newly combined company is now named Better Home & Finance Holding Company and became traded on the public exchange as of August. Better.com has been a wellknown innovator in the mortgage tech space and has been expected to go public for some time.

Additionally, Shopify acquired Deliverr, and SMS Assist was acquired by Lessen. Deliverr is an e-commerce fulfillment company, integrating with major players such as Walmart, eBay, Amazon, and BigCommerce, as a provider of seamless logistics support and two day shipping services. Thus, we may think of Deliverr as operating predominantly in the Living category of the PropTech Barometer. SMS Assist, by contrast, has focused specifically on a single element of the property lifecycle: facility maintenance. Indeed, SMS Assist has redefined the way property owners work with service providers. Every day, more than 200,000 individual properties rely on their technology platform to deliver an exceptional maintenance experience. Unfortunately, however, we were not able to confirm the details of the other deals, all of which took place between companies based in Hong Kong or the People’s Republic of China, and it is striking that our data source was absent the details of these deals, along with the details of the two major Corporation Service Company deals. This is a reminder that some data remains hidden until deals are fully completed. However, most recently Get Living – an operator of a build-to-rent digital platform designed to service the private rental sector – sneaked into the top ten when the Qatari Diar Real Estate Investment Company sold their stake to Aware Super, the $99.81 Billion USD (A$150 billion) superannuation fund.

Figure 4: Top 500 Investment Deals by Country (2022-2023)


Although we will take a closer look at global trends in Chapter 3, a survey of the top 500 deals reveals some notable trends. Both the largest single deals and the greatest amount of capital amassed across the top 500 sample deals were concentrated in the United States, followed by the People’s Republic of China, and then the United Kingdom. A second tier then emerges of Italy, France, and India, with the UAE and Canada forming a third tier, only to be followed by Sweden and Australia rounding out the top ten countries. Similarly, the second tier of single-largest deals includes those in Italy, the UAE, Sweden, India, and France. However, by the third tier of the largest individual deals, we begin to see a more diverse subset of markets, including Germany, Japan, Belgium, Spain, Israel, and so on. What is of note is that while the total capital amassed among the top 500 deals is still concentrated in a few predictable locations (the US, UK, and China), when we broaden our vision to begin to take into consideration significant individual deals, we are seeing key players emerge in really interesting, comparatively newer PropTech markets, such as Chile, Brazil, Indonesia, Kuwait, Colombia, Malaysia, and Thailand. Of course, we are also seeing a number of the top 500 deals in Pacific Rim markets (Australia, Japan, South Korea, Canada, and Mexico, among them) are important players, as are European markets like Spain, Austria, and Belgium.

Figure 5: Total Capital Raised by Fund Category (2022-2023)


Across the 2022 to 2023 fiscal year, we do not see substantial changes in relative allocations of capital raised by most fund categories. For instance, while Private Equity made up a significant 43.01% of the total capital raised in the past year, this is the most significant percentage point increase from the decade long trend of 39.73%. The second most significant change is the relative growth of Real Assets investments (.72%) and the relative decline of Venture Capital (-1.06%), in terms of percentage of the total when compared to the decade long trend, which confirms the story that real asset investments have gradually stepped in to replace the resources of slightly declining venture capital activity in the wake of rising interest rates and other macro-economic indicators.

Figure 6: Investment Deals by PropTech Categories (2022-2023)


Across a sampling of the 500 most significant deals in the PropTech industry from the 2022-2023 fiscal year, several observed trends emerge. The largest deals in PropTech are concentrated in the Managing and Investing categories – as well as in the Industry Verticals concentrating on B2B services and Financial Services. While the Managing category attracts $23.03 Billion USD, Investing attracts substantially less, at around $11.39 Billion USD. However, B2B services and Financial Services are categories that each make up nearly $15 Billion USD. This suggests that there is a substantial sector of the Managing market that is engaged in Financial Services. We could regard these trends as evidence of the financialization of the PropTech market. As the Building and Living categories make up smaller portions of the contemporary market, the initial evidence suggests substantial room for growth remains in those categories in the near future.

While the numbers are not absolute, the general trend is for a greater number of these deals in the Information Technology category to be associated with Seed Round, Early-Stage VC, and Later Stage VC funding. Meanwhile, the larger deals in the other three categories tend to be a robust mix of debt financing, PIPE, and Mergers and Acquisitions. While mergers and acquisitions get the greatest press, especially Better. com’s recently announced reverse merger, a deeper examination of the Information Technology subsector could reveal interesting trends. For instance, among the top ten deals in this category of companies, we find Later Stage VC deals making up six of the top deals, with the remainder being Early-Stage VC (1), Merger and Acquisition (1), Equity Crowdfunding (1), and PE Growth/Expansion (1) rounding out the top ten.

Figure 7: Top VC Investors (2022-2023)


Of course, there are several measures for top investors in a given fiscal year. We can consider total assets – or the sum of the book values of all assets owned by a company – where, of course, Citigroup, Barclays, Wells Fargo, Goldman Sachs, and Morgan Stanley come in soundly in the top five. We could also measure by revenue – being the amount of money generated by normal business operations – where we might get a more interesting mix, including Alphabet, The Home Depot, and Reliance Industries breaking into the top five. However, if we examine the “total active portfolio” – referring to the sum of the currently active investments that an individual company is involved with – we get an even more interesting snapshot, where the top investors include Plug & Play Technologies, Y Combinator, Techstars, the National Science Foundation, and Innovate UK, as previously indicated. However, when we narrow the list to the Top VC investors, we get an even more interesting picture.

The Top 10 most active companies involved in VC deals in the past 12 months include Techstars, FJ Labs, Plug and Play Technologies, Y Combinator, Goodwater Capital, Antler, Fifth Wall, MetaPropNYC, JLL Spark, and Second Century Venture. Naturally, most of these deals when considered by fund count – or the raw number of funds making investments in a category – and category are from companies focused on Venture Capital.

However, a significant portion are Private Equity (12.11%), Real Assets (8.27%), and Private Debt (4.47%) deals. Notably, a quarter-by-quarter examination of these fund counts over the course of the past five years reveals a reliable trend: fund counts increase in the fourth quarter of the calendar year, or first two quarters of the fiscal year, when capital invested also tends to peak. However, this was not the case in 2022-2023.

Instead, the highest the capital raised from venture peaked in summer 2022 and the fund count from venture peaked in the winter quarter, during a period when capital investment significantly declined. While capital investment recovered in the first two quarters of 2023, the fund count continued to decline. The question for the first quarters of the 2023-2024 fiscal year remains whether or not the year will follow long-term trends, with a winter-time growth in fund counts and capital invested, or if the relatively lower number of funds involved with the market currently is an indicator of future lower levels of capital activity by VCs.

Mergers & Acquisitions

Figure 8: Mergers & Acquisitions by Company Category (2022-2023)


The above image shows the number of Mergers and Acquisitions across our four key PropTech categories for the 2022-2023 fiscal year. As we can see, much of the market consolidation occurred in the Managing segment of the market. In addition to the aforementioned Lessen acquisition of SMS Assist, three notable M&A deals were Inside Real Estates acquisition of BoomTown!, Inhabit’s acquisition of LMPM and CoreLogic’s acquisition of Roostify. BoomTown! Has been an industry leading cloud-based marketing and sales automation platform servicing more than 100,000 real estate professionals. Next, Inhabit, a software company servicing residential and vacation rentals, added LMPM, a property management system designed to support the vacation rental industry. LMPM supports bookings, inventory, work orders, and payment processing, among all other elements of managing vacation rentals.

Finally, Roostify has been a digital mortgage technology provider, and has thus been added to CoreLogic’s leading property information, analytics, and data-enabled solutions portfolio. The deal will allow clients to gain critical information about borrowers and properties at the beginning of the loan origination process, saving time and money. However, because this was also the sector with the largest share of the market in terms of capital raised, the evidence suggests that there was a strong correlation between the capital involved in deals and the number of M&A deals in particular for the Managing category. However, we do not find this correlation to be as strong with the Investing and Building category, as there was less capital raised in the Building category, but, relatively speaking, a quite significant difference in the number of M&A deals. That said, when we examine the year-on-year difference across all of our categories, a trend of interest emerges.

Figure 9: Mergers & Acquisitions by Industry Vertical (2021-2022 Vs. 2022-2023)


The above image shows the number of M&A deals by Industry Vertical across the past two fiscal years. We can see that while the Financial Services segment of the market appears to not exhibit any notable trend in terms of evidencing market consolidation, the other three Industry Verticals do. B2B, B2C and Information Technology companies all had a very significant number of M&A deals. However, the number of M&A deals declined substantially from last year across all three of these categories.

Thus, the evidence suggests that much of the trend of market consolidation we were predicting did continue. At the same time, the pace of this market consolidation appears to have slowed ever so slightly.

Overall, the deal count for Mergers and Acquisitions, almost half of the deals involved Information Technology companies this past year, while both the B2C and B2B categories came in at between 20 and 25% of the share, with 49 and 41 individual M&A deals respectively. Financial services made up a much smaller proportion of these deals and only accounted for 6.67% of the total deals, with just 13 individual M&A deals this past year. A small portion of these deals also involved companies predominantly operating in the Materials and Resources sector (.51%, or a single individual M&A deal) or in the Healthcare sector (1.03%, or two individual M&A deals) but also involving PropTech companies. Top investors involved especially in Mergers and Acquisitions is a much narrower list from the 2022-2023 fiscal year when compared to previous cycles in the past half decade.


If we were to examine top investors involved in M&A by their total revenue generated for the year and total assets in the year, we arrive at a list of major players, including Reliance Industries, Oracle, Intuit, IQVIA, and United Rentals. However, each of these major players was only involved in a single deal this past year, meaning that while they were keeping pace with the market, they were not disrupting their position. The possible exception to this trend is the Hexagon Group, in the number 11 spot, which was involved in four deals.


As measured by activity, other than Hexagon, only Constellation Soft, Blueground, Habyt, InspectionGo, Texas First Rentals, Trimble, View Media Group, and Volaris were involved in multiple deals this past year. Finally, while most of the deals were concentrated in the North Atlantic (United States: 41.24%, United Kingdom 9.79%, Canada 5.67% and Germany 4.64%) we see the emergence of a number of European and Asian markets on the total list for the past twelve months, including countries like Portugal, the United Arab Emirates, India, Thailand, Malaysia, Spain, and Italy.

41.24%
9.79%
5.67%
4.64%

A disruptor is someone who builds something better, more efficiently, faster, and that’s why clients choose to go with the disruptor. But also it’s about the organization that you are building in the background, developing a new or fresh approach on how to build your team…our vision is ‘How do we make people feel at home wherever they are?’ that’s our outward and inward vision.

Alex Chatzieleftheriou - CEO and Co-founder, Blueground a provider of fully furnished short-term and long-term stays in the best locations around the world

Top Performers

Figure 10: Top 500 PropTech Deals by Category (2022-2023)


The above image shows the Top 500 PropTech Deals by company category for the 2022-2023 fiscal year. Notably, the enormous Healthcare Trust of America deal in the Investing category was large enough to outpace the largest deals from the Building and Living category combined. At the same time, the Managing category made up nearly half of the market share. Technologies applied to property management are thus diverse and far reaching, including Better.com and Corporation Services Company – two companies involved in managing very different segments of the real estate market. In addition to the aforementioned deals in the Managing and Living categories, two top deals in the Living and Investing categories are of note. First, Cainaio Network Technology Company is a provider of logistics that operates at the intersections of big data, e-commerce, supply chain technology and PropTech. Their primary technological innovation, however, is their logistics data platform, which offers real time information on shipments in any city in China. Setpoint also utilizes technology to unlock new speed and efficiency, but does so in the Investing space, by digitizing assets like homes, verifying and storing documents, and automizing rate calculations.

Figure 11: Top 500 PropTech Deals by Category and Quarter (2022-2023)


The above image helps aid us in visualizing how the PropTech market transformed over the course of the fiscal year. We see that the largest investing deal, HTA, was really quite an anomaly, although there were also outsized deals in the Managing category in the Fall Quarter of 2022, as well as outsized deals in the Building category in the third quarter of 2022-2023. The Fall of 2022 was marked by a large Onewo Inc’s IPO deal and a general debt deal for Emeria Europe. Onewo Inc is a property management service provider in China, leveraging various technologies to better assign office spaces, manage commercial complexes, and even industrial parks and public premises. The company’s predecessor was the property services segment of the major Chinese firm, Vanke. By contrast, Emeria Europe emphasizes leveraging technology in the aid of managing residential properties for the sake of owners, tenants, and commercial clients in Europe. By the end of 2022 and the first months of 2023, Vanke, also known as China Vanke was on the map again, as the large residential developer announced it was in talks to secure CNY 15 billion from yet undisclosed investors in one of the most substantial PIPE deals in the Building category.

Another major deal was an early stage VC round of funding to support the growth of Gropyus, an Austrian company that designs buildings as continuous evolving products, emphasizing both affordability and sustainability in their construction. However, that investments dropped off in terms of number across all categories from the middle of the Winter Quarter of 2022-2023 through the Spring Quarter of 2023, as geopolitical stressors and market pressures amidst a series of bank failures would begin to worry investors.